- rhn.chandra AT gmail.com
- +1 647 834 1636
Vision Research
University of Toronto - CSC2431H: Machine Learning in Computational Biology
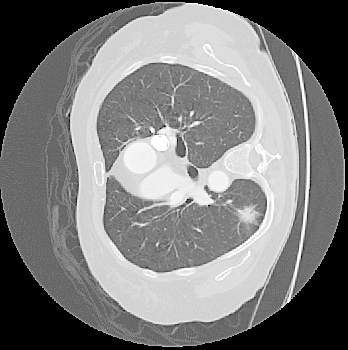
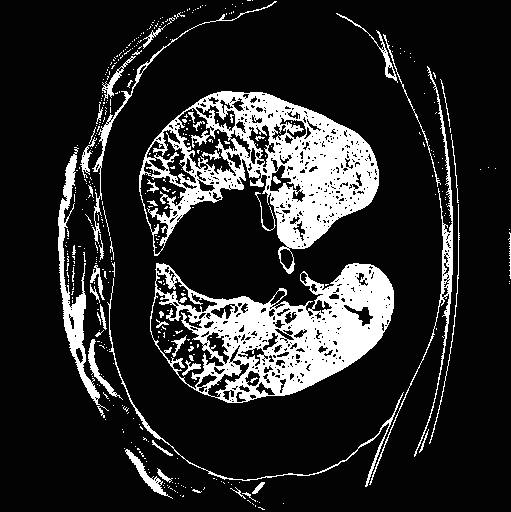
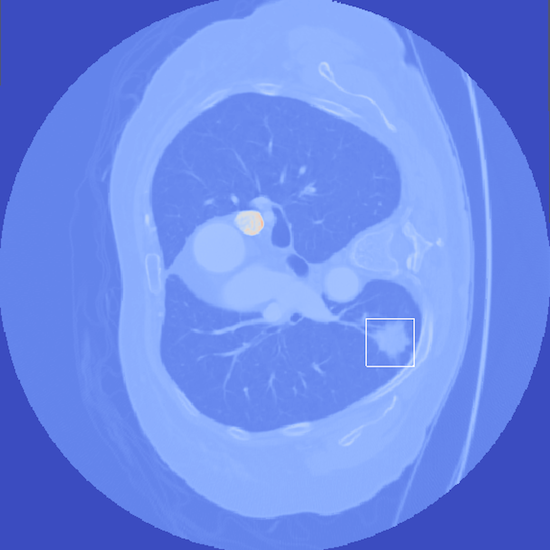
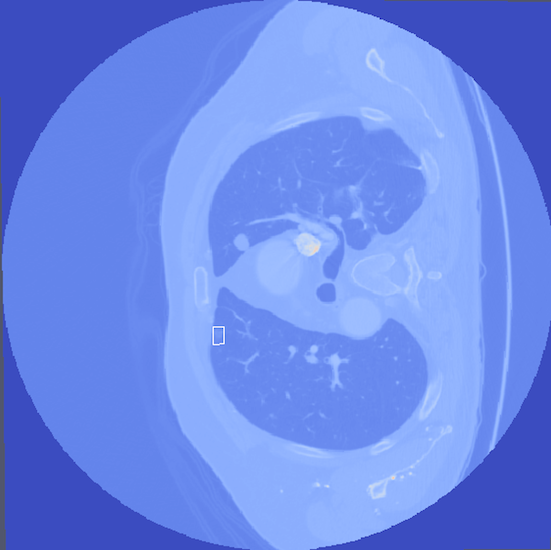
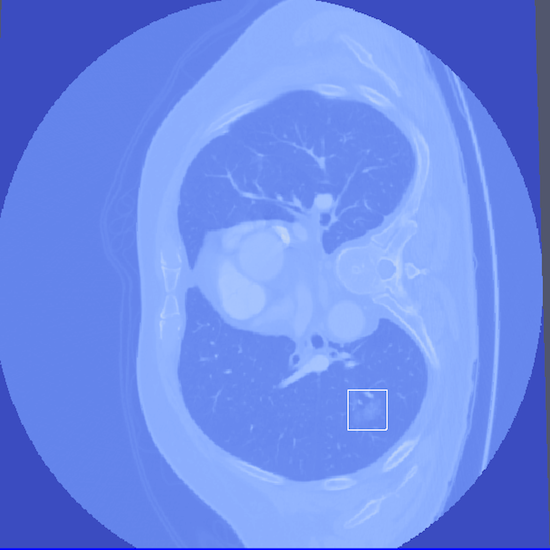
- Abstract: An exploration of whether conventional detection methods of lung cancers in low dose spiral CT scan could be improved using curvature features. In general, a large source of inaccuracy in detection rates can be attributed to irrelevant anatomical structures such as blood vessels. Often these irrelevant anatomical structures have different shape characteristics from lung nodules. For example lung nodules tend to appear bloblike as oppose to blood vessels, which appear cylindrical, or organ walls, which appear planelike. These curvature features were determined using eigenanalysis of the local second order image Hessian of each voxel, where the principal values are indicative of the local shape and provide more information than analysis performed on first derivatives alone.
- Method Overview: In each CT scan, the internal 3D lung volume was isolated using standard thresholding of pressurevalues ranges associated with lung parenchyma. The remaining voxels were conjoined using a connected components method, implemented through a union-find method, with small and isolated components removed. The remaining gaps were filled in using a standard 3D image closure method. First and second order partial derivatives were computed using Deriche filters, chosen for their stability and suitability in medical image scans. Then, for each of the voxels in the internal volume of the lung the local second order Image Hessian was generated and analyzed for preferred directions using eigenanalysis. This information was then used to weight the contribution of each voxel to standard lung nodule detection methods, to determine if giving stronger weight to voxels with local blob-like shape improved detections results.
- Key words: Curvature features, 3D imaging, Medical Imaging, Deriche Filters, Eigenanalysis of second order Image Hessian
|
|

|
|
|
|
Bottom Row: Examples of lung nodule detections.
lungNoduleCurvatureFeatures-Proposal.pdf
lungNoduleCurvatureFeatures-Report.pdf
Intel - Intelligent System's group (September 2012 - ongoing)
- Abstract: Ongoing work on the detection and tracking of pedestrians, in a typical shopping environment, using a Microsoft Kinect. Currently focusing on learned deformable part models in conjunction with depth information to overcome occlusion.
Please contact me for additional details on this project
Intel - Intelligent System's Group
Authors: Rohan Chandra, Abhishekh Ranjan, Shahzad Malik
- Abstract: Describes a real time method to remove the areas of unknown values commonly found in the raw depth image provided by the Kinect with information provided by edge structure found in the accompanying aligned RGB image.
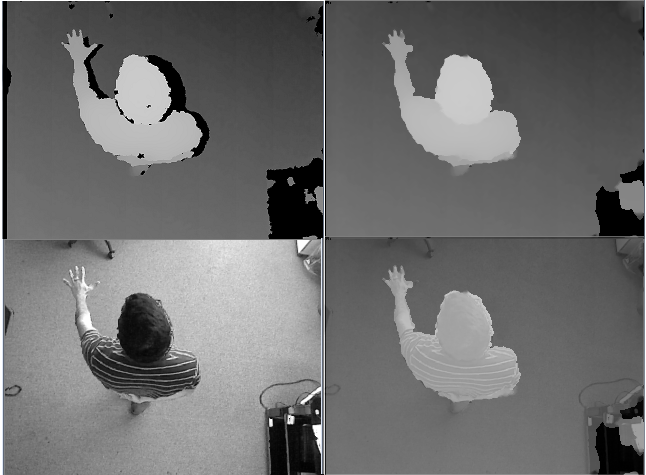
Top left: the raw depth image, top right: filled depth image, bottom left: the aligned RGB image, bottom right: an overlay of the filled depth image overtop the RGB image.
Citation: Rohan Chandra, Abhishek Ranjan, Shahzad Malik, “TECHNOLOGIES FOR INCREASING THE ACCURACY OF DEPTH CAMERA IMAGES”, International Patent number: PCT/US2013/041864
Please contact me for additional details on this project
University of Toronto - CSC494: Projects in Computer Science (January 2012 - August 2012)
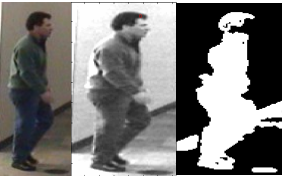
- Abstract: An implementation of the simultaneous Segmentation and 3d Pose estimation method detailed by Bray, Kohli, and Torr (2008)[1]. Extends the method to help overcome issues in the initialization phase, specifically initial detection of pedestrians and the ability to handle multiple pedestrians in a scene. Detection is performed by searching for likely head and torso positions using separate head and torso part detectors with a deformation penalty between proposed head and torso locations. The initial detection forms a prior for the pose estimation, where the prior is formed as a elliptical Gaussian extending from the center of the head to the base of the spine. The segmentation of a pedestrian is determined by the minimum energy cut on the network graph formed by the Markov Random Field (MRF) local to the intensity values in the image around the pedestrian, with the assumption that pixels along the pose prior are highly likely to be in the foreground. Finally, a 3d Pose of a pedestrian is inferenced by optimizing the minimum energy cost to the MRF across all pose parameters.
- Key words: Segmentation, Human detection, 3d Pose estimation, Deformable part model, minimum energy cut, network flow, Markov Random Field
University of Toronto - CSC420: Visual Computing (September 2011 - December 2011)
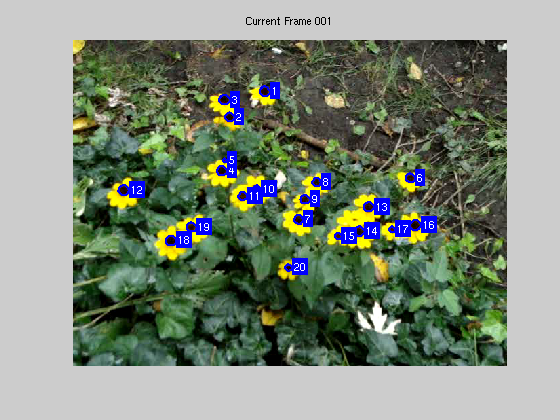
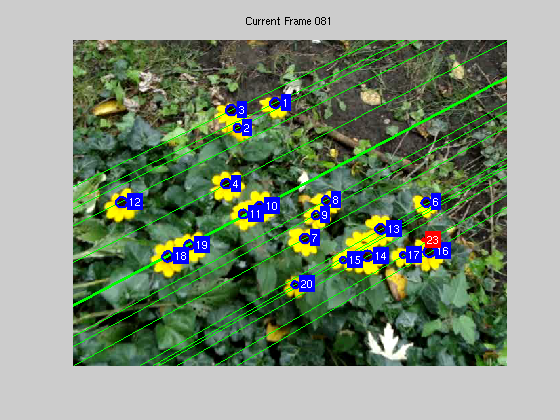
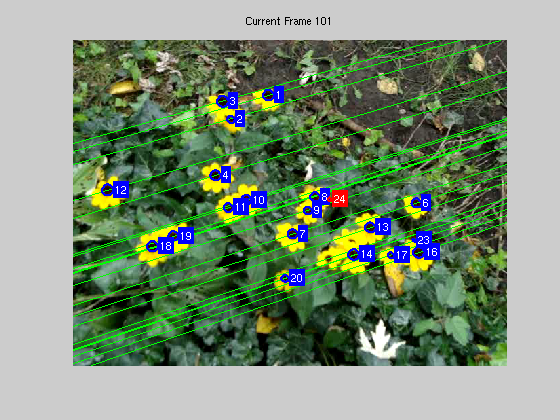
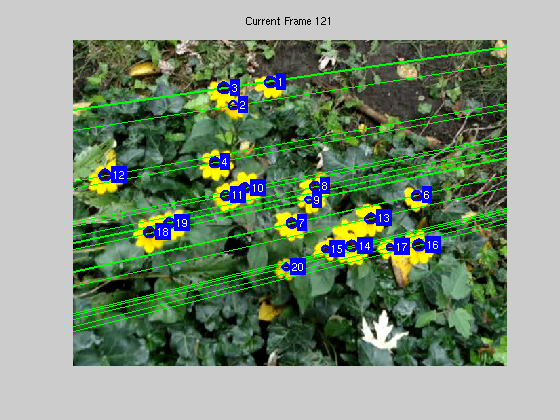
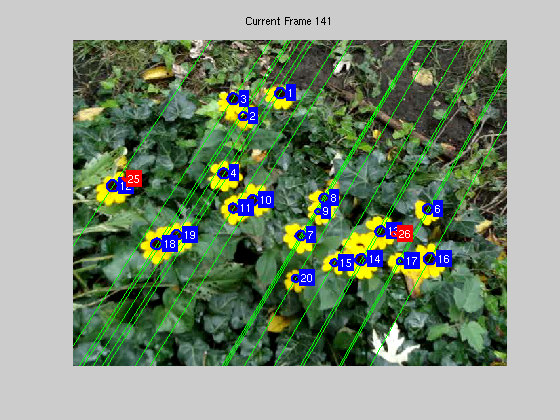
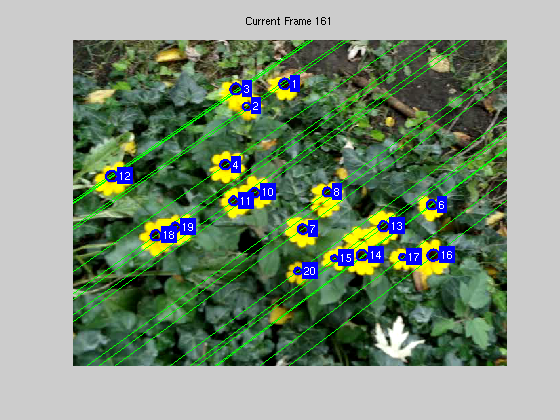
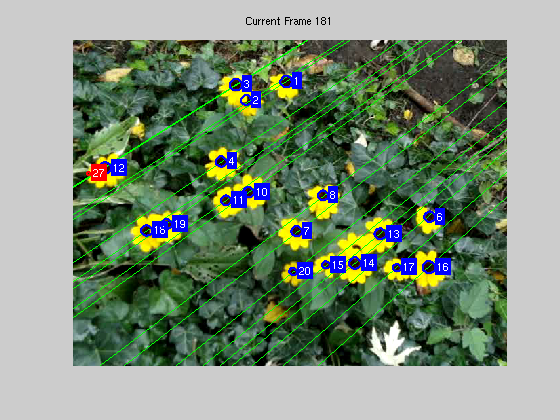
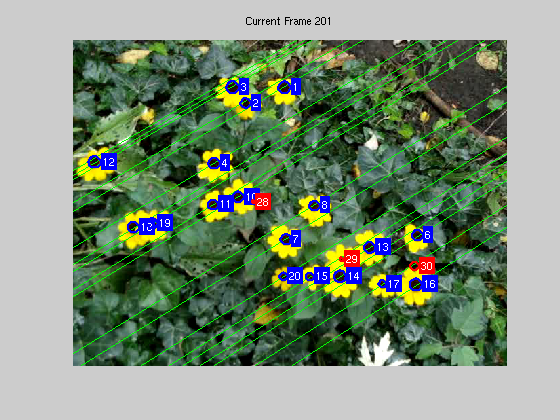
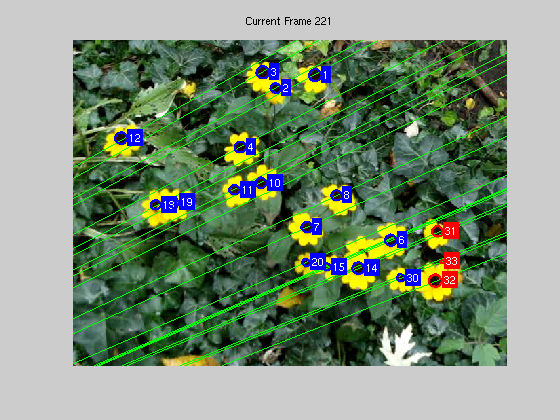
- Task: Design a system to detect a specific species of bright yellow flowers in an image sequence, and identify them as distinct individuals throughout the sequence. Specifically the system must keep track of unique labels or names for each flower, and maintains their names across the sequence.
- Abstract:
- Detection of flowers is performed by using a colour slab detector to search for regions with the particular frequency of yellow associated with the species of flower. A wider range of color frequencies associated with the brown inner region of the flower is detected in a similar manner. The intersection of the dilated yellow and brown regions gives a set of pixel that may on the edge of the center of some flower, known as edgels. Circles are fit to groups of edgels via a RANSAC estimation of multiple models method approach. These final circle locations are used as the location of individual flowers.
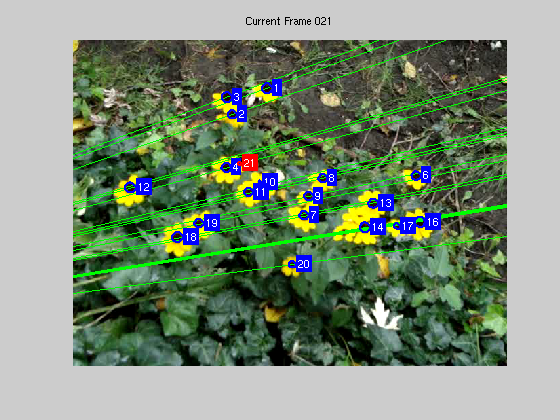
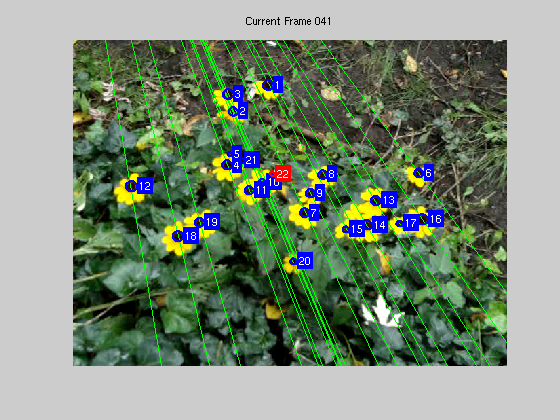
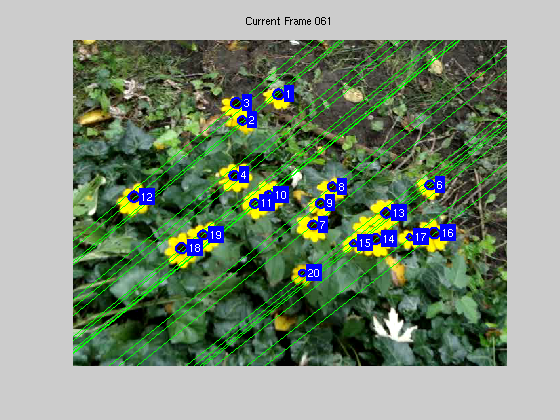
- Each detected flower center is assigned a label. After a set number of frames has passed, new flower centers are discovered in the current frame and must be matched with those in the original frame. SIFT correspondence is determined between the two frames and used to determine the F matrix between the two frames. With the F matrix, the epipolar geometry of the scene can be determined. For a flower in the original frame, an epipolar line is generated in the current frame. If the F matrix is accurate, then the position of the flower from the original frame must lie near to the epipolar line in the current frame. Thus, correspondence to the flower in the original frame is determined based on finding the flower in the current frame closest to the epipolar line generated by the flower in the original frame and comparing the radii of proposed corresponding flowers. A database of flower positions is maintained at each frame in the event that flowers go out of the scene and later reappear and must be matched.
- Key words: Object recognition and tracking, color detection, circle fitting, RANSAC, estimation of multiple models, epipolar geometry, motion estimation, Harris Operator.
|
|
|
|
|
|
|
|
|
|
|
|
Results with correspondence deteremined every 20 frames
Results with correspondence deteremined every 50 frames
University of Toronto - CSC420: Visual Computing (September 2011 - December 2011)
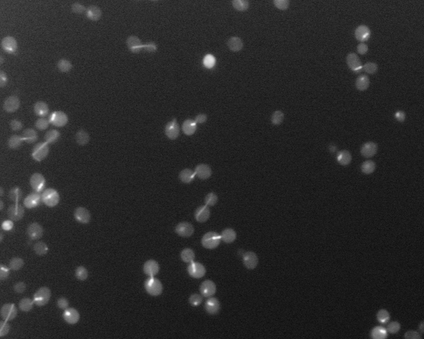
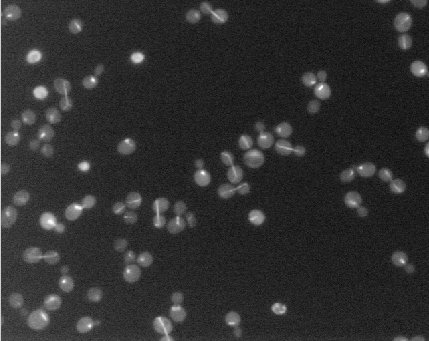
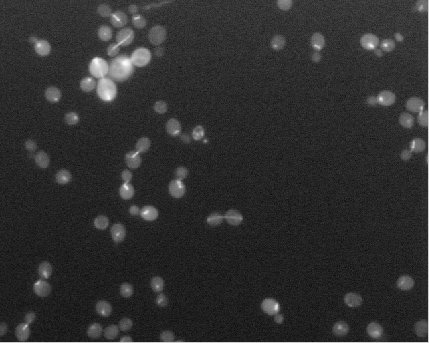
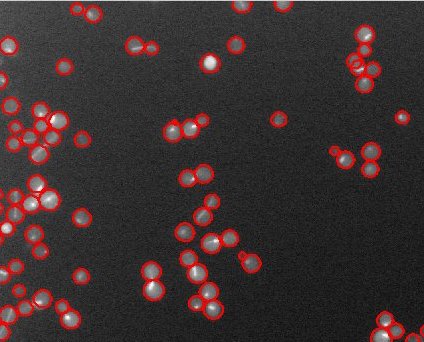
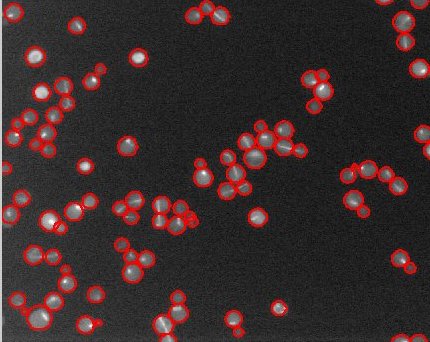
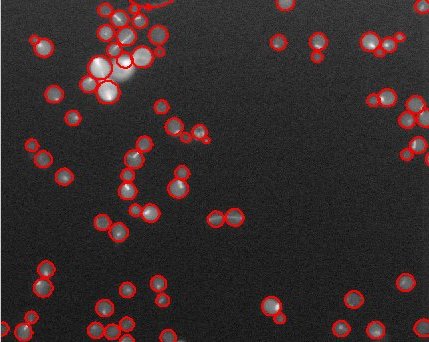
- Task: Automatically count and identify all the cells present in a given a microscope image. Note that a method to identify pixels that may lay on the edge of cell (edgels) based on frequency analysis was provided as start code.
- Abstract: To form initial cell location proposals, local groups of edgels that may lie on the boundary of the same cell are detected by a connected components method over the set of all edgels. For each component, two random edgels are selected, assumed to be on the boundary of the cell, and the intersection of their normals is computed as a proposal for the center of the circle and accompanying radius. If the normals do not intersect, or intersect at an improbable distance, the proposal is rejected and new edgels selected. A scoring function evaluates circle proposals for the cell based on how many edgels lie on the proposed circles and edge compared to how many lay within it, generally favoring smaller circles. This allows edgels that originate from a dividing cell, or overlapping cells, to be accurately divided into multiple circles. The highest scoring circle is choosen over several RANSAC trials and the edgels on the boundary of the circle are removed from the overall set in the graph, continuing until no edgels or valid circle proposals remain.
- Key words: Circle fitting, RANSAC, estimation of multiple models.
 |
 |
 |
|
|
 |
University of Toronto - CSC411: Machine Learning (September 2011 - December 2011)
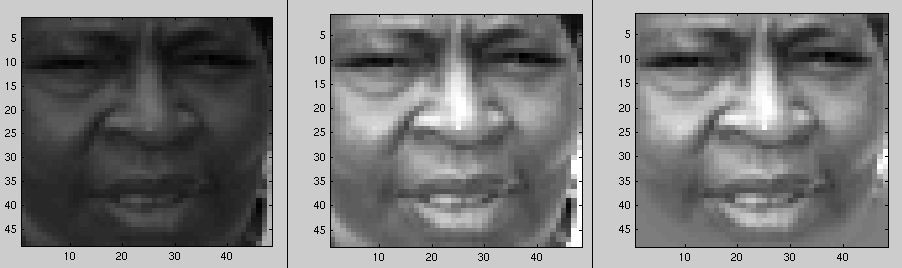
- Task: Given a photograph of a person's face identify the emotion being shown, within the range of emotions of sad, happy, angry, neutral, etc. Note, given aproximately 5000 labelled faces and 98000 unlabelled faces.
- Abstract: The primary focus of our work was to improve the results of the relatively simple classifier by increasing the amount of available training data through unsupervised labeling of the unlabeled data set. To normalize faces in color and orientation, the eyes of the face are located based on contrast and used to align the face to one common alignment using a homography transformation. Additionally, an oval shape mask is applied to remove irrelevant details present in the background behind the face of the individual. Subtracting the overall mean face from the face to be classified mitigated differences in lightning and skin color. After preprocessing, the 55 largest principal components were calculated through PCA decomposition on both data sets. The components of the faces in the labeled set were quickly compared against those in the unlabeled set using knn, and those with sufficient confidence were autonomously labeled and included in the training data. The classifier was formed as a multinomial linear regression with l2 regularization trained on the significantly expanded test set after preprocessing.
- Key words: Unsupervised learning, emotion recogonition, image transforms, color normalization, mutlinomial regression.